01Capability
Driver-Input UI With Sliders
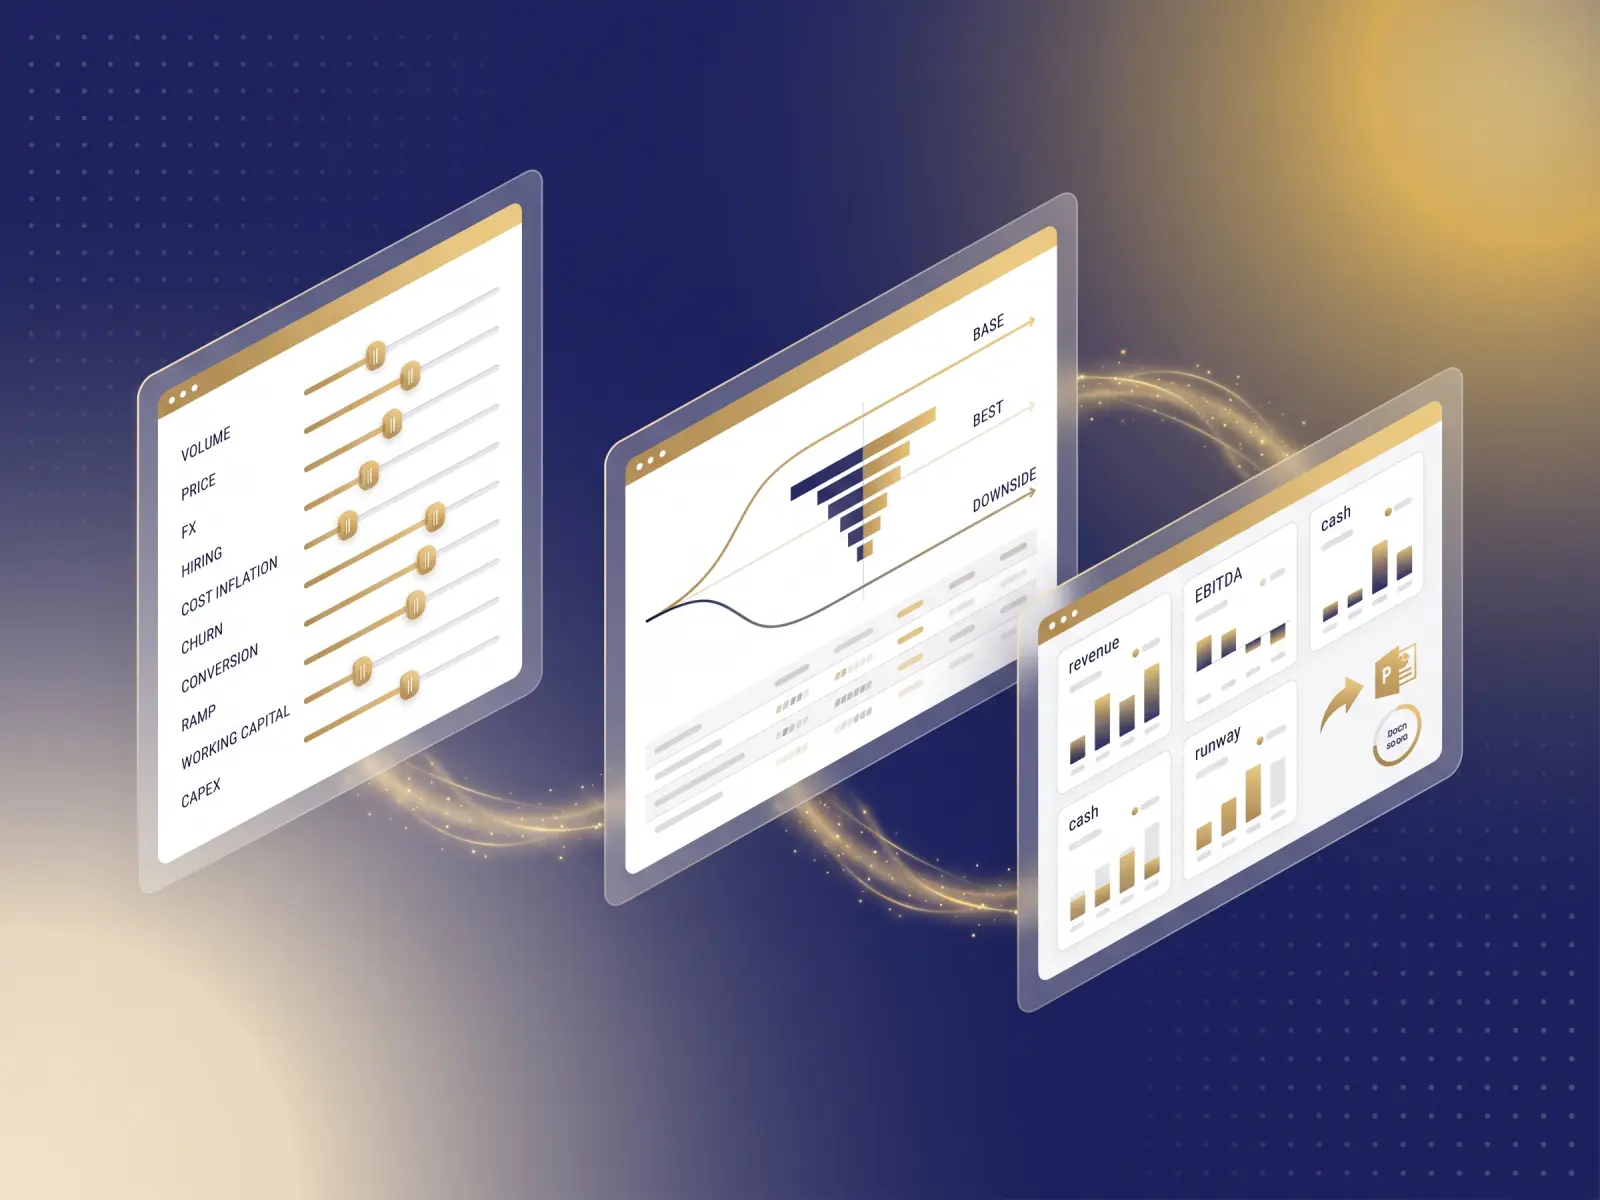
Top 10 drivers exposed as sliders — volume, price, FX, hiring pace, cost inflation, churn, conversion. Drag, re-run, compare. No formula edits, no model archaeology.
Builds. Stresses. Compares. Presents
Builds what-if scenarios on key drivers — volume, price, FX, hiring, cost inflation, customer churn. Stress-tests sensitivity, compares baseline vs scenarios, prints board-ready comparison decks. CFO walks into the board meeting with three plausible futures, not one wishful forecast.


By the numbers
The use case
Board asks 'what if FX moves 5 percent'. Two days of Excel later, the FP&A team answers — and the board has already moved on. Scenario model from last quarter is broken because hiring forecast diverged. Sensitivity analysis collapses on entity number 4. Three scenarios needed for the offsite — the team had time for one.
Scenario Agent exposes the top 10 drivers as sliders, runs sensitivity tables and tornado charts on demand, compares baseline against N scenarios side by side, exports a branded PowerPoint deck. Live re-run when actuals refresh — scenarios stay current. CFO walks into the board with three plausible futures and the driver attribution behind each one.
For who
Capabilities
Top 10 drivers exposed as sliders — volume, price, FX, hiring pace, cost inflation, churn, conversion. Drag, re-run, compare. No formula edits, no model archaeology.
One-click generation of sensitivity tables — revenue elasticity to price, EBITDA elasticity to volume, runway elasticity to hiring. Tables ready for the appendix.
Tornado charts ordered by impact magnitude. Board sees the top 5 drivers at a glance. No PowerPoint formatting time, no chart-rebuild after every model update.
Side-by-side baseline vs N scenarios on the same axes — revenue, EBITDA, cash, runway. Diff highlighted. Drag any scenario up to lead, others retain rank.
Continue exploring
Auto-calculates month-end accruals from receipt history, payroll cadence, utility patterns, and recurring-service signals.
Learns your approval patterns and routes invoices to the right approver automatically, escalating exceptions in real time.
Assembles the audit document request list (PBC), pulls evidence from every system, drafts walkthroughs, reconciles GL accounts to source, hands off to auditors with full traceability.
ISO 27001:2022 · GDPR · EU-hosted · Full audit trails · Trust Center →
Start free. See your first workflow run before the next quarter close.